
TradingView Vs StockCharts : A Detailed Comparision
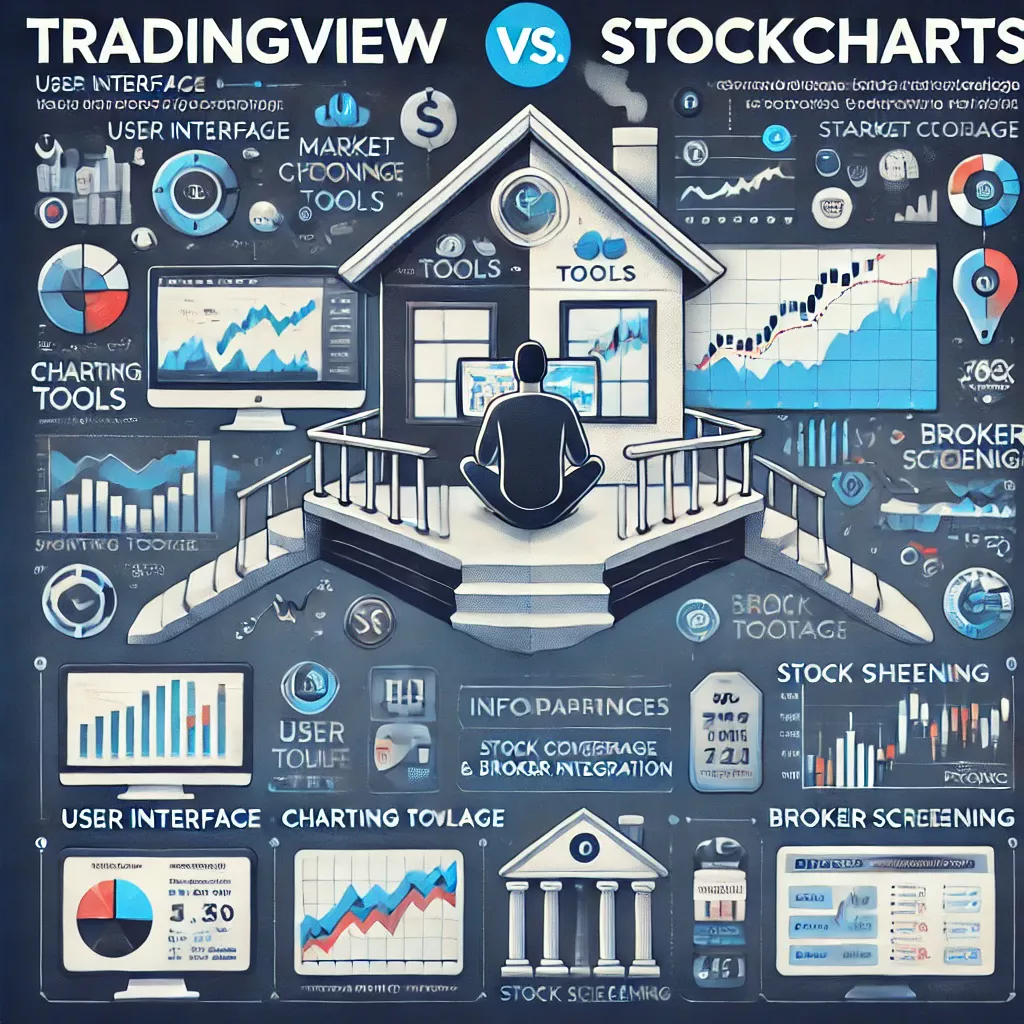
TradingView vs StockCharts: Which Charting Platform is Better for Traders?
In the world of technical analysis and stock market trading, having the right charting platform can make all the difference. Two of the most popular platforms for chart analysis are TradingView and StockCharts. Both offer robust tools, indicators, and features that cater to traders and investors, but they also have distinct differences in usability, pricing, and features. This article provides an in-depth comparison between TradingView Vs StockCharts, helping you decide which platform is best suited for your trading needs.
Overview of TradingView
TradingView is a cloud-based charting and social networking platform that has gained massive popularity among traders worldwide. It is known for its user-friendly interface, extensive indicator library, and social trading features.
Key Features of TradingView
- Advanced Charting – TradingView provides interactive, highly customizable charts with multiple timeframes, indicators, and drawing tools.
- Social Trading – Users can share trade ideas, follow other traders, and engage in discussions.
- Extensive Market Coverage – Supports stocks, forex, cryptocurrencies, commodities, indices, and futures.
- Pine Script – A powerful scripting language for creating custom indicators and automated strategies.
- Multiple Device Access – Accessible via web browser, desktop application, and mobile app.
- Alerts and Notifications – Customizable alerts based on price levels, indicators, and strategies.
- Broker Integration – Allows live trading through supported brokers.
Overview of StockCharts
StockCharts is a well-established charting platform that has been a staple in the industry for decades. It is widely used by traders and investors who prefer traditional technical analysis tools and a reliable data source.
Key Features of StockCharts
- High-Quality Charting Tools – Offers different charting styles, including SharpCharts, Point & Figure, and Renko charts.
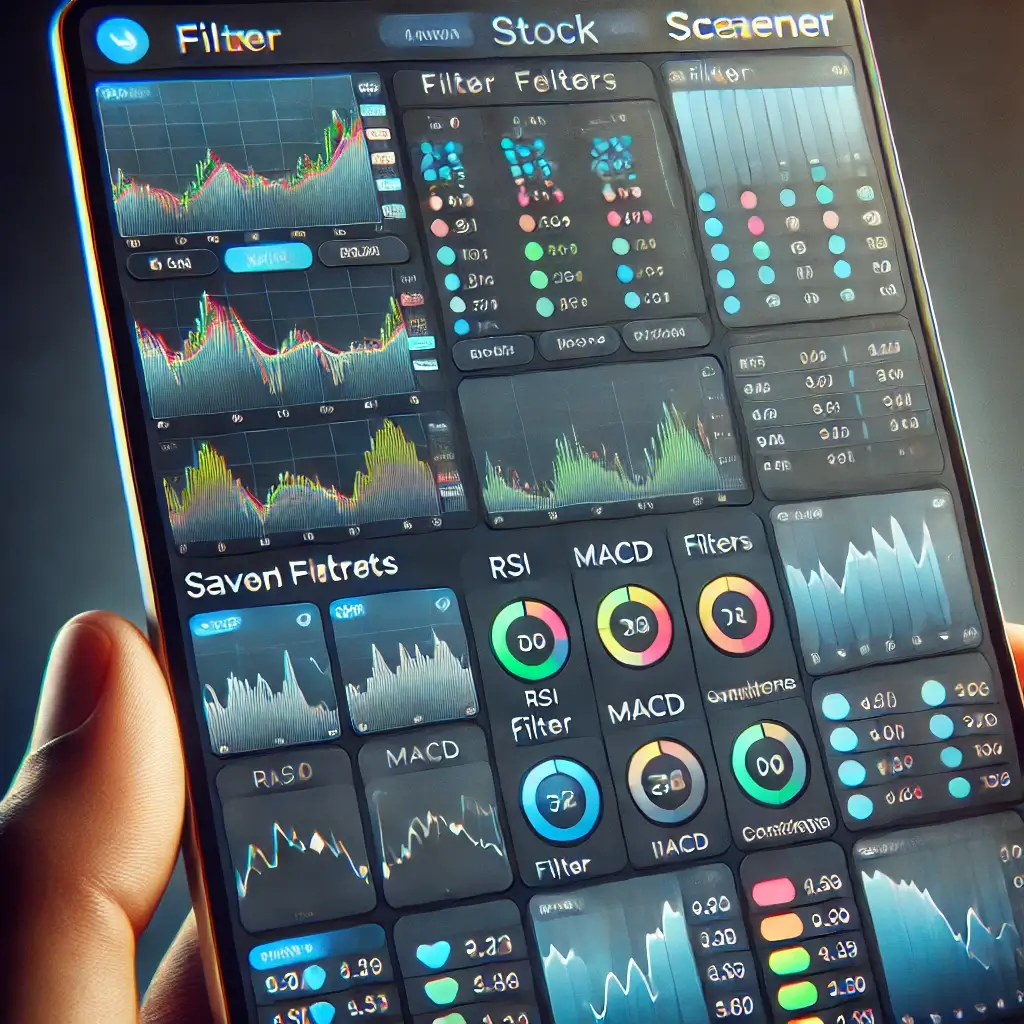
- Scan Engine – A powerful stock screener with custom criteria for finding trading opportunities.
- Market Summary & Reports – Provides pre-built and custom reports for in-depth market analysis.
- ChartLists & Annotations – Allows users to save and organize charts for future reference.
- Technical Indicators – Supports numerous technical indicators and overlays.
- Education & Resources – Offers training materials, webinars, and expert commentary for traders.
- No Social Features – Unlike TradingView, StockCharts focuses purely on charting and analysis without social trading features.
Comparing TradingView Vs StockCharts
1. User Interface & Ease of Use
- TradingView has a sleek, modern interface that is easy to navigate. The drag-and-drop functionality and intuitive charting tools make it user-friendly even for beginners.
- StockCharts, while functional, has a more traditional and somewhat outdated interface. The platform is geared towards experienced traders who prioritize analytical tools over visual appeal.
Winner: TradingView – It offers a more modern and intuitive user experience.
2. Charting Tools & Customization
- TradingView excels in customization, offering a vast library of indicators, drawing tools, and multiple chart layouts.
- StockCharts also provides high-quality charts, but they are less customizable compared to TradingView. The charting experience feels more static.
Winner: TradingView – More flexible and feature-rich for charting enthusiasts.
3. Indicators & Technical Analysis
- TradingView provides over 100 built-in indicators and allows users to create custom ones using Pine Script.
- StockCharts offers a solid selection of indicators but lacks scripting capabilities, limiting customization.
Winner: TradingView – More flexibility and the ability to create custom indicators.
4. Stock Screeners & Scanning Tools
- TradingView has a built-in screener for stocks, forex, and cryptocurrencies, with real-time filtering options.
- StockCharts offers a more powerful stock scanning tool with detailed fundamental and technical filters.
Winner: StockCharts – More advanced scanning and filtering tools for stock traders.
5. Market Coverage & Asset Classes
- TradingView covers a wide range of markets, including stocks, forex, cryptocurrencies, commodities, and indices.
- StockCharts focuses primarily on the stock market, with limited support for other asset classes.
Winner: TradingView – More comprehensive market coverage.
6. Social Trading & Community Features
- TradingView has a strong community aspect, allowing traders to share ideas, publish strategies, and interact with others.
- StockCharts does not offer social trading features.
Winner: TradingView – The social aspect adds a valuable dimension to trading.
7. Alerts & Notifications
- TradingView offers advanced alert features based on price, indicators, and strategies, with SMS and push notifications.
- StockCharts has alerts, but they are not as comprehensive or customizable.
Winner: TradingView – More advanced and flexible alert options.
8. Broker Integration & Live Trading
- TradingView allows users to trade directly through integrated brokers such as Interactive Brokers and Tradovate.
- StockCharts does not support live trading through brokers.
Winner: TradingView – Direct broker integration makes it more convenient.
9. Mobile & Desktop Applications
- TradingView offers web, desktop, and mobile applications with full functionality.
- StockCharts is primarily web-based, with limited mobile support.
Winner: TradingView – More accessibility across devices.
10. Pricing & Subscription Plans TradingView Vs StockCharts
| Feature | TradingView | StockCharts |
|---|---|---|
| Free Plan | Yes | No |
| Basic Plan | $14.95/month | $14.95/month |
| Pro Plan | $29.95/month | $24.95/month |
| Premium Plan | $59.95/month | $39.95/month |
- TradingView offers a free plan with limited features, while StockCharts does not have a free version.
- StockCharts provides lower pricing for premium plans but lacks some features available in TradingView.
Winner: TradingView – A free plan and better value for higher-tier subscriptions.
Pros and Cons Summary
TradingView
✅ Modern and user-friendly interface
✅ Wide range of assets covered
✅ Extensive customization and scripting capabilities
✅ Integrated social trading features
✅ Broker integration for live trading
❌ Higher pricing for advanced plans
StockCharts
✅ High-quality traditional charting tools
✅ Advanced stock scanning capabilities
✅ Comprehensive market reports and analysis
✅ Lower cost for premium plans
❌ Outdated interface and less customization
❌ No social trading or broker integration
Final Verdict: TradingView Vs StockCharts, Which is the Best Charting Platform?
If you are looking for a modern, customizable, and multi-asset trading platform with social features, then TradingView is the better choice. Its intuitive interface, extensive market coverage, and community-driven approach make it ideal for both beginners and advanced traders.
On the other hand, if you prefer a more traditional charting experience focused on stock market analysis, then StockCharts may be a better fit, especially if you rely on its powerful scanning tools and market reports.
Who Should Use TradingView?
- Active traders and investors across multiple asset classes
- Traders who want broker integration for live trading
- Those who value social trading and community engagement
- Users who need advanced alerts and scripting options
Who Should Use StockCharts?
- Traditional stock traders who prefer classic charting tools
- Investors who need advanced stock screening and scanning tools
- Traders looking for in-depth market reports and analysis
- Those who do not require live trading integration
Both platforms have their strengths and weaknesses, but in terms of overall features, flexibility, and innovation, TradingView comes out ahead as the best all-around charting platform for most traders.