
RSI Indicator Divergence : Best Indicators for Divergence and Trading Opportunities
The Relative Strength Index (RSI) is a popular momentum oscillator used in technical analysis to measure the speed and change of price movements. RSI divergence is a critical concept that helps traders identify potential reversals and continuation patterns in the market. This guide explores RSI divergence in detail, explaining its types, how to identify it, and how traders can use it to make informed trading decisions.
Understanding RSI Indicator Divergence
RSI divergence occurs when the price of an asset moves in the opposite direction of the RSI indicator. This divergence signals a potential shift in market momentum and can indicate an upcoming reversal or trend continuation.
There are two primary types of RSI divergence:
- Bullish Divergence
- Bearish Divergence
1. Bullish Divergence
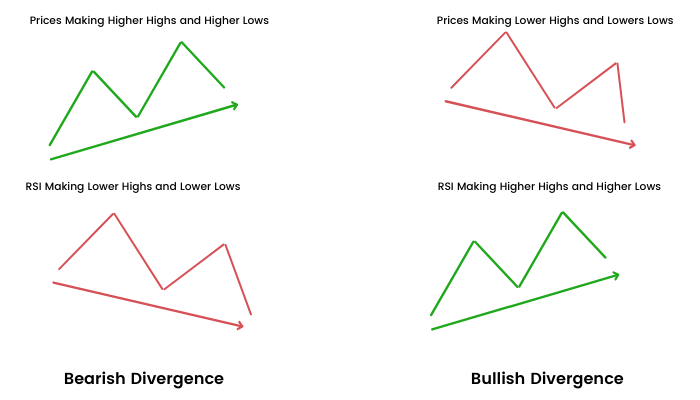
A bullish divergence occurs when the price of an asset makes lower lows, but the RSI indicator forms higher lows. This indicates that although the price is declining, the momentum behind the decline is weakening, potentially leading to a reversal to the upside.
Use Case: Identifying Buying Opportunities
When a bullish divergence is identified, traders may consider entering long positions. Here’s how a trader might utilize bullish divergence:
- Identify lower lows in price while RSI shows higher lows.
- Look for confirmation through other indicators (e.g., moving averages, MACD, volume).
- Enter a buy trade when the price action confirms a reversal pattern (e.g., bullish engulfing candle, double bottom, or trendline breakout).
- Set a stop loss below the recent swing low.
- Set a target based on resistance levels or Fibonacci retracement levels.
Example Trade
Imagine a stock is in a downtrend and reaches $50, forming a lower low. However, RSI forms a higher low at 30, indicating weakening bearish momentum. A trader might enter a buy trade at $52 when a bullish engulfing candle appears, set a stop loss at $48, and aim for a take profit at $60 based on prior resistance.
2. Bearish RSI Indicator Divergence
A bearish divergence occurs when the price of an asset makes higher highs, but the RSI indicator forms lower highs. This suggests that despite price increasing, the momentum is weakening, potentially leading to a downward reversal.
Use Case: Identifying Selling Opportunities
Traders can use bearish divergence to identify potential short-selling opportunities:
- Identify higher highs in price while RSI shows lower highs.
- Look for confirmation through other technical indicators.
- Enter a sell trade when price action confirms a reversal pattern (e.g., bearish engulfing candle, head and shoulders, or trendline breakdown).
- Set a stop loss above the recent swing high.
- Set a target based on support levels or Fibonacci extensions.
Example Trade
Suppose a cryptocurrency surges to $40, forming a higher high. However, the RSI indicator forms a lower high, indicating a loss of momentum. A trader might enter a short trade at $39 when a bearish engulfing candle appears, set a stop loss at $42, and target $35 based on prior support.
Hidden RSI Indicator Divergence
Hidden divergence is another useful concept that traders can apply. Unlike regular divergence, hidden divergence signals trend continuation rather than reversal.
1. Hidden Bullish Divergence
- Price makes higher lows, but RSI forms lower lows.
- Indicates the continuation of an uptrend.
2. Hidden Bearish Divergence
- Price makes lower highs, but RSI forms higher highs.
- Suggests the continuation of a downtrend.
Use Case: Trend Continuation Strategy
Traders use hidden divergence to confirm existing trends and add to their positions rather than anticipating reversals. For instance:
- In an uptrend, if hidden bullish divergence appears, traders may add to long positions.
- In a downtrend, if hidden bearish divergence appears, traders may add to short positions.
Combining
RSI Indicator Divergence with Other Indicators
For higher probability trades, traders often combine RSI divergence with other technical tools such as:
- Moving Averages: Using the 50-day and 200-day moving averages to confirm trend direction.
- MACD (Moving Average Convergence Divergence): Checking for crossovers that align with RSI divergence signals.
- Volume Analysis: Confirming divergence with decreasing or increasing volume.
- Support and Resistance: Ensuring divergence aligns with key levels.
Common Pitfalls and How to Avoid Them
While RSI divergence is a powerful tool, traders should be aware of the following pitfalls:
- False Signals: Divergence alone may not always result in a reversal. Confirmation with other indicators is crucial.
- Overbought and Oversold Misconception: RSI divergence can occur even when RSI is not in the overbought (above 70) or oversold (below 30) regions.
- Ignoring Trend Strength: In strong trends, RSI divergence may not always result in immediate reversals.
- Improper Timing: Entering a trade solely based on divergence without waiting for confirmation can lead to losses.
RSI indicator divergence is an essential tool in technical analysis that helps traders identify potential reversals and trend continuations. By recognizing bullish and bearish divergences, traders can make informed decisions on entry and exit points. However, divergence should be used in conjunction with other technical indicators and confirmation methods to improve accuracy and avoid false signals. With practice and proper risk management, traders can effectively incorporate RSI divergence into their trading strategies for improved results.